
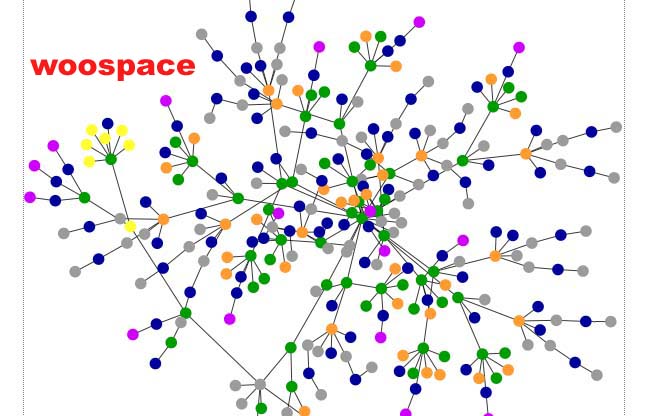
Follow this link and enter a website's address, for all you bloggers, you can also enter your own as I have done. The program creates a graph that show's how the site is structured. Blue = tags, Red = Tables, Green = Div tag, violet = images, yellow = forms, orange = linebreaks, Grey = all other tags. Kind of geeky fun.

No comments:
Post a Comment